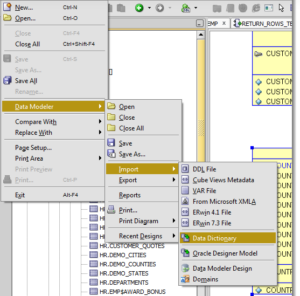
You can use SQL to create a view on tables and feature classes in an enterprise geodatabase to restrict what columns or records are available to view users, or you can define a view to join information from two tables or a feature class and a table. When you include the spatial column in the view definition, view users can visualize the features in a map in an ArcGIS Desktop client.
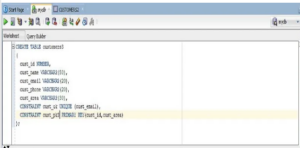
[mai mult...]Create a table in Oracle
Manually Reboot a Switch
When a switch is rebooted, the running configuration file is deleted. Before proceeding with the reboot instructions, make sure to save all the running configuration settings to avoid data loss. If you would like assistance with the reboot, check out the article Download or Back Up Configuration Files on a Switch.
[mai mult...]No network access when connecting PC to the CenturyLink Modem directly
If there is no network access when connecting the PC to the CenturyLink Modem directly, you might have configured the modem as Transparent Bridging mode.
[mai mult...]Configure TP-Link Wireless router
The PC can get network access when connecting it to the CenturyLink Modem directly.
[mai mult...]Configure your network switch
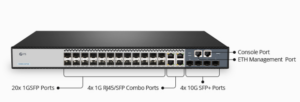
Check the model number of your shiny new switch. Or, if you are using a spare, check the device hardware and its connected cables for any damages. If everything checks out, power on the switch and verify that all the indicator lights are in working order. Next, use a rollover cable to console into the switch from your computer. To do this, you will need to download and install Putty (or a similar, fun-named software tool). Run Putty and select the 9600 speed serial connection.
[mai mult...]Use Insert, Design and Layout options in Word
Word offers multiple tools in the toolbar and this solution is going to present how you can use Insert, Design and Layout.
[mai mult...]Use References, Mailing and Review options in Word
Microsoft Word offers a lot of tools via the toolbar and this solution is going to present how we can use three of them.
[mai mult...]Navigating the Microsoft Word Toolbar
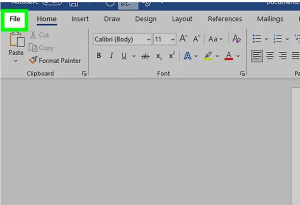
Click the File tab. It’s in the top left side of the screen (or in the menu bar for Mac users). From here, you have several useful options on the far left side of your screen:
- Info (PC only) – Click this to review the documents statistics, such as when it was last modified, as well as any potential issues with the document.
- New – Click this to bring up the “New Document” page that lists all of the pre-formatted templates. Opening a new document will prompt you to save your old one.
- Open – Click this to review a list of recently-opened documents. You can also select a directory (e.g., “This PC”) in which to search.
- Save – Click this to save your document. If this is your first time saving this particular document, you’ll be prompted to enter a name, save location, and preferred file format as well.
- Save As – Click this to save your document “as” something (e.g., a different name or file format).
- Print – Click this to bring up your printer settings.
- Share – Click this to view sharing options for this document, including email and cloud options.
- Export – Click this to quickly create a PDF or change the file type.
Create a basic document in Word
- To create a basic document, choose a template from the list provided or start with a blank document.
- Use the File tab to open, save, and start documents, and the Insert tab to add any images, symbols, or other media to your document.
- Highlight your text and play around with formatting options in the “Home” tab. You can change the font, italicize/bold/underline your words, and play around with font size.


